Check out our brand new Health Check Dashboard, alongside new reporting tools like Staff Performance, Transaction, and Inventory Reports.
Health Check Dashboard 2.0
The Health Dashboard gives you a total overview of your Salon’s Health. It gives you an easy-to-digest visual dashboard of sales, staff performance, client visit times and more. The graphs display financial health against KPIs.
What’s new?
Our new Health Check Dashboard 2.0 makes it easier than ever to get the ‘bigger picture’ of your Salon’s financial health. We now offer easy-to-access Financial data such as Total Revenue, Average Bill, Daily Sales and more.
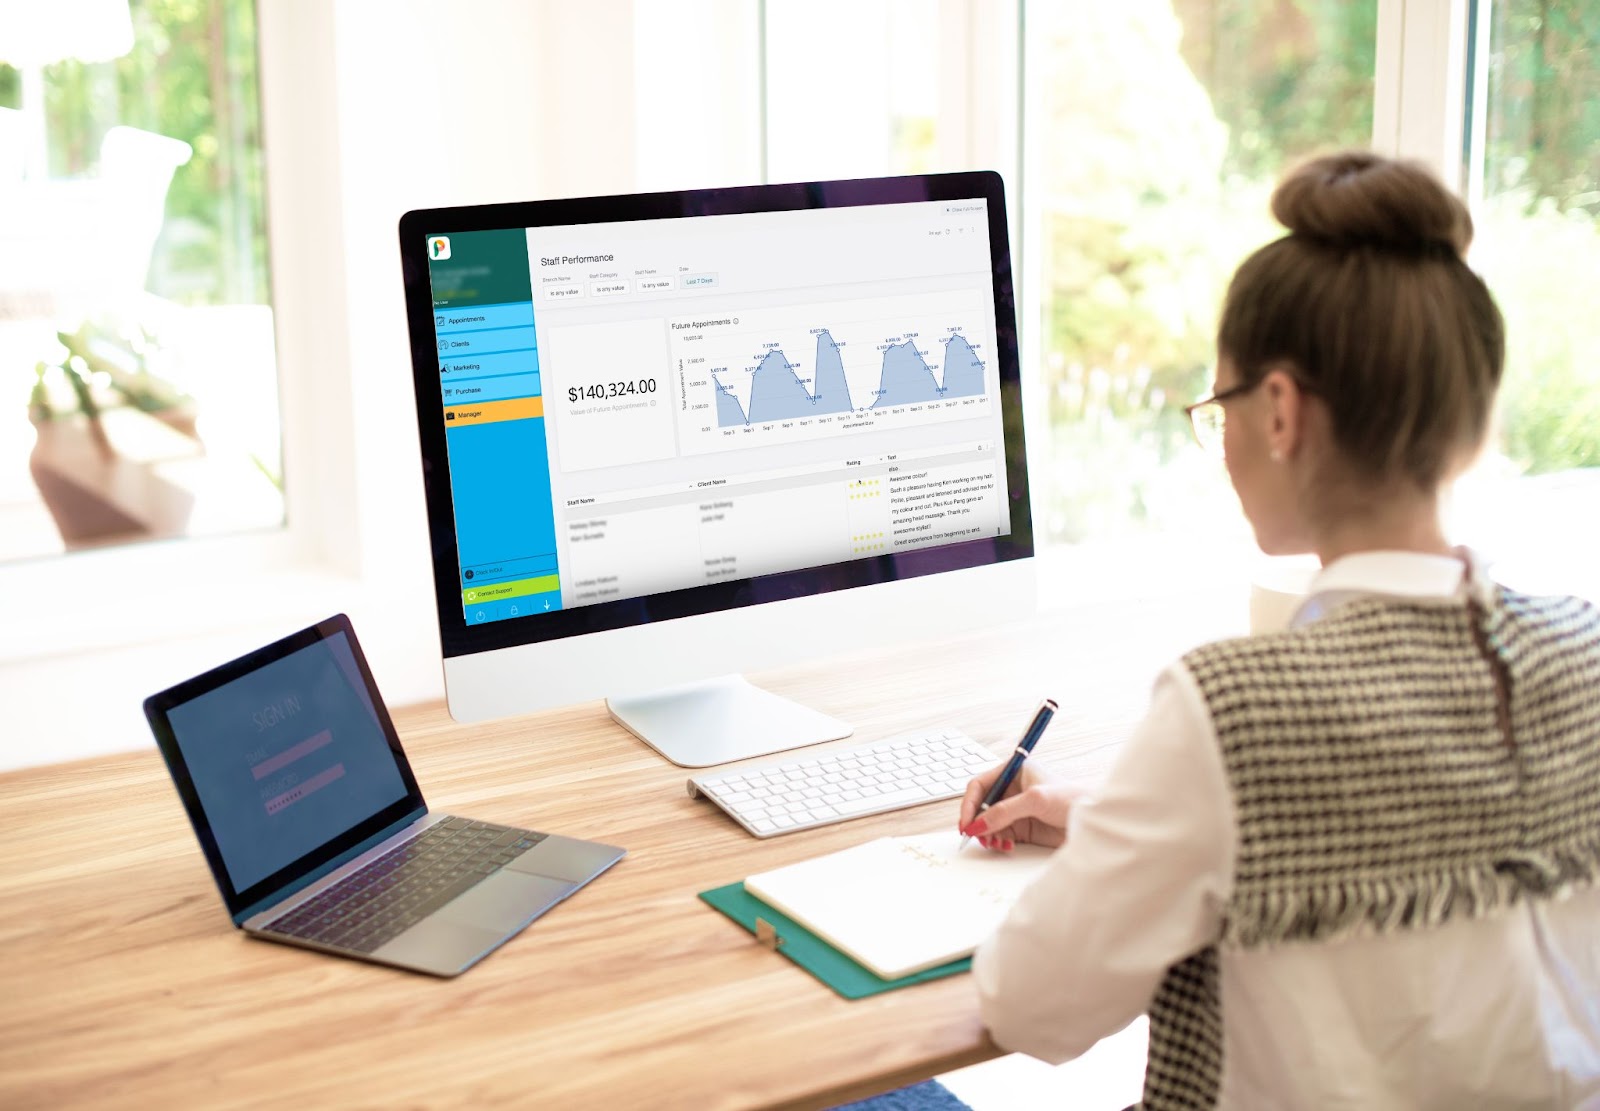
The Health Check Dashboard 2.0 now includes a view on Client Visit Peak times, which can help Salon’s improve operational efficiency, including Client Visits, % Rebooked, Daily Client Visits, and Peak Times. Reports are also now available on PhorestGo.
Why should you use the Health Check Dashboard 2.0?
The aim of our new Health Check Dashboard is to empower Salons to make better business decisions. By summarising all key information on one dashboard, you can see what is working and what isn’t. From this dashboard, you can dig deeper into the numbers that matter using the rest of Phorest’s Reporting functionality.
How do I access it?
Go to Manager > Reports and choose the Health Check tab.
Read more about using the health check dashboard here.
New Reports: Staff Performance Report, Transaction Report, Inventory Report
We are pleased to announce that we’ve expanded our Reporting functionality to include better staff performance reports, transaction reports, and stock reports.
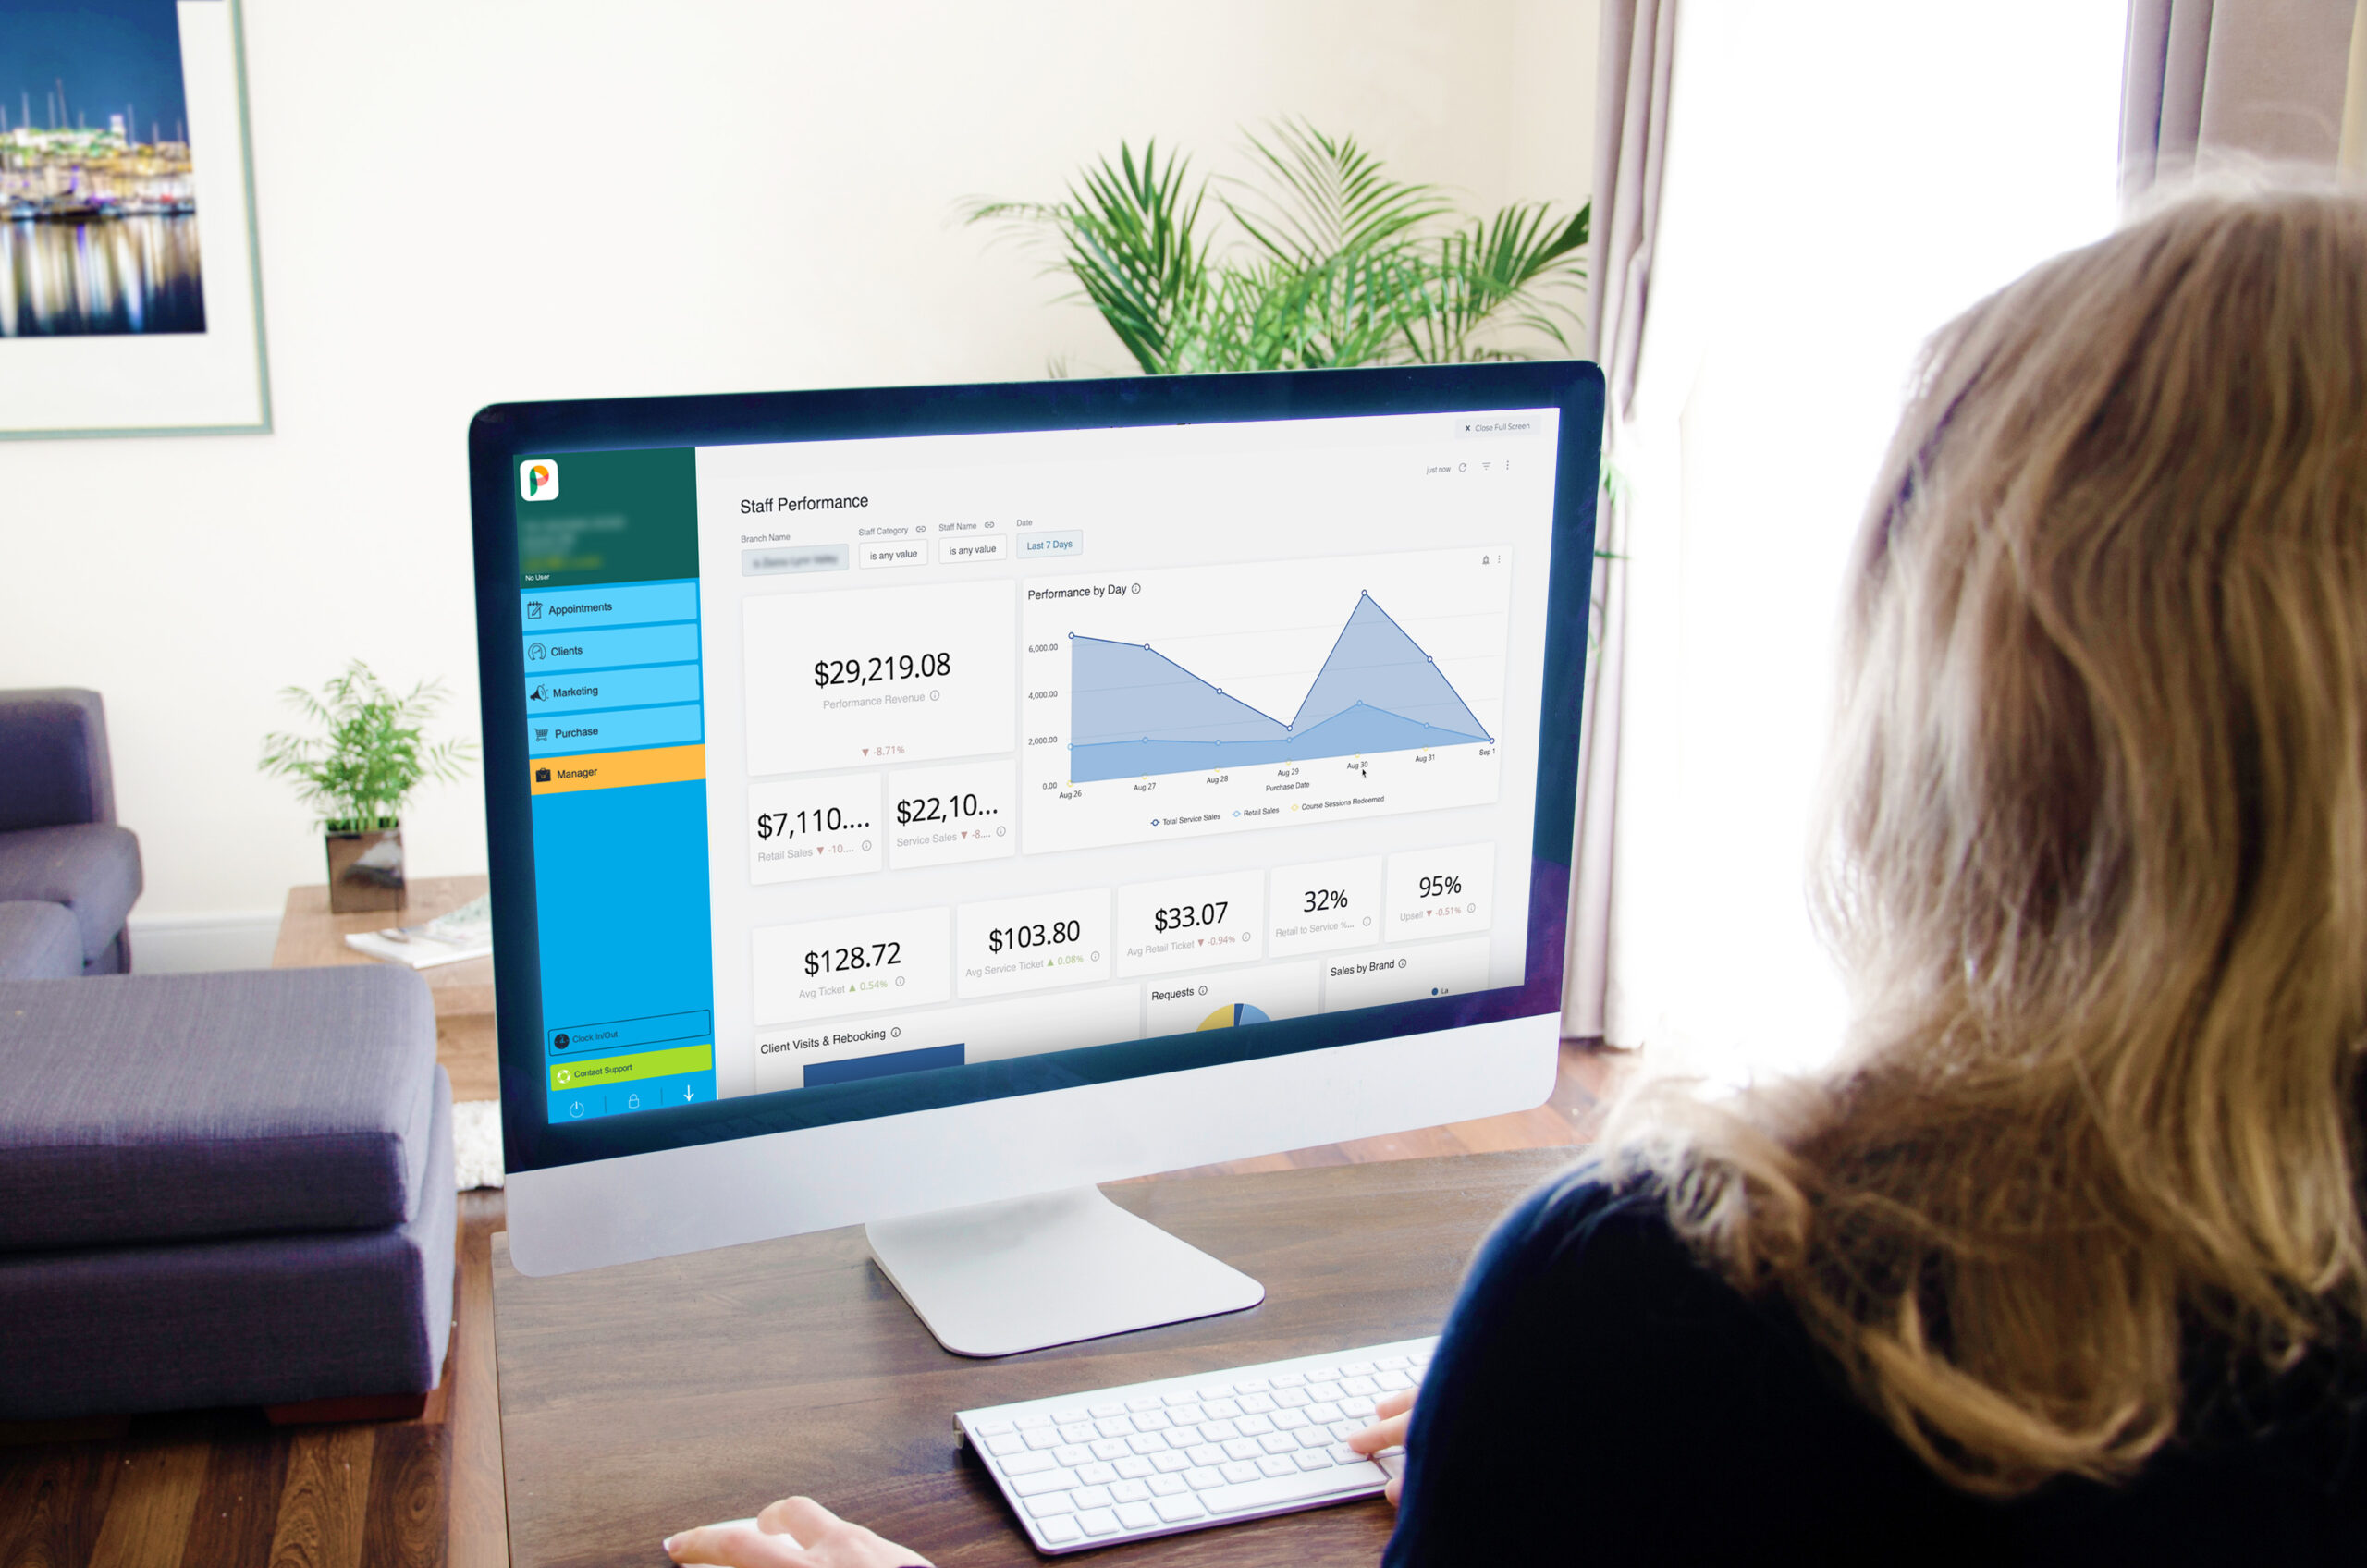
Staff Performance Reports
We now have key staff KPIs included in our reporting. Use this feature to identify high performing and underperforming staff. You can break these reports down by service type, client retention rates, and rebooking rates.
You have more tools at your disposal to manage your team’s efficiency and improve how you operate. Use KPI data to granularly identify individual performance and team performance.
Transaction Reports
We have included transaction reports which gives you a breakdown of sales by transaction type, transactions over a period of time, and volume.
Use this data to give you a better understanding of what your most valuable transactions are, when they happen, are they used in conjunction with other services etc.
Inventory Reports
As a manager, we know how important it is to keep track of stock regularly to make sure you are not running out of any particular product. With our new stock reports, it is now easy to see insights into product retail sales, stock flow, stock value, under and overstocked items.
With this feature you can track best selling products, product sales per staff, as well as stock levels and automatically add VAT, GST, and other tax.
How do I use these reports?
Go to Manager > Reports and you will see 3 tabs: Health check, Finance and Staff. Inside each of these tabs you will see all of the above tools available to you.
To find out more about using the new Staff Performance, Transactions and Inventory reports click here.